Welcome to the Matsertool
Welcome to the Matsertool! This tool is replacing regular excel tools with the goal of saving time and making your life easier! All you have to do is choose the tool you want to run, as well as provide the necessary input. Need help? The Help tab provides you with the information you need. The Matsertool contains tools for all phases of a project: Setup, Fieldwork and Analysis.
You should always look at the 'Help' tab before using a tool. This tab tells you what the input should look like and will give you tips. This prevents unnecessary issues.
If you're using the Generic Recoder, VS Recoder, eComm Recoder or the McD Masterfile Processor, download the input templates here!Feedback, questions or requests? Contact your local toolmaster for help and fill in the feedback form. We need your feedback to improve the tools!
Last update to codes: 10th of July 2026 by Mats
33
Tools Available
Tool information
This Help sheet will help clarifying the use and input of this tool. Anything still unclear or is the tool not working? Contact a toolmaster.
Choose a tool to see the description.
Compare Inputs
- When to use: You have two files that should be identical and want to verify this.
- What it does: Compares 2 files and reports whether they match. For XLSX files, checks sheet-by-sheet.
- Inputs: 2 files of the same type (both CSV or both XLSX).
- Output: Match/mismatch report; for XLSX shows exactly which sheets differ.
The Compare Inputs tool checks whether 2 files are exactly the same.
- For CSV files : the tool indicates whether the files are identical.
- For XLSX files : the tool checks each sheet individually and reports which sheets match and which differ.
Make sure the 2 files you upload have the same file extension.
Correspondence Analysis
- When to use: You want to map brand/category positioning relative to a set of criteria.
- What it does: Runs Correspondence Analysis and generates 4 positioning plots showing how brands/categories and criteria relate to each other.
- Inputs: 1 CSV with the average choice score per column (criteria), one row per brand/category.
- Output: 4 plots (symmetric, row principal, contribution biplot, brands-only) + coordinates CSV.
Upload 1 CSV file containing the average choice per column in a grid, for each brand/category you want to investigate.
The tool produces 4 plots :
- Symmetric plot: Shows both criteria and brands/categories. Distances represent similarities/dissimilarities, giving an overview of the overall structure and identifies patterns of association between brands/categories.
- Row Principal plot: Shows both criteria and brands/categories, but with a focus on brands/categories. Highlights the relationships between rows and can reveal clusters or groups of similar categories based on their profiles across the columns
- Contribution Biplot: Shows both criteria and brands/categories. Shows which criteria contribute most to variability and how they relate to each other.
- Brands/categories only: A clean plot showing only the brands/categories.
Please have a look at the example below, in which respondents were asked for either Lancome, Dior or Guerlain, whether they agreed with the statements (Special, Exclusive, etc). Looking at Lancome-Special, the average response to this question was 0.19. The average response must lie in between 0 (never chosen) and 1 (always chosen).
CA input example:

Counts
- When to use: After recoding, to get frequency counts from your SingleCSV.
- What it does: Calculates counts per concept/level. Supports DR-None correction, VS multibuy correction, SKU-Price counts, and segment splits.
- Inputs: SingleCSV; optionally a segment file, SKU/Price column names.
- Output: Excel file with colour-coded count tables.
Upload your SingleCSV and indicate the following options:
- DR-None: Indicate whether your SingleCSV has a DR-None.
- VS Multibuy: If you ran a VS multibuy study, enable this so counts for SKU and Price are corrected for double rows. Promo counts are not corrected, as these reflect actual preference.
- SKU-Price counts: For large SKU-Price studies, you can get counts of prices shown and chosen per SKU. Provide the names of your SKU and Price columns.
- Segment counts: To run counts per sub-group, upload a CSV with respondent numbers in column A and segment number in column B.
Note: this is a simplified version of counts. The Counts tool in Excel has additional functionalities for which you can add SKU data (share, distribution, etc.).
CT Code Recoder
- When to use: When recoding CT Code / Evoked Set data (used by IT / Data Science).
- What it does: Replaces the CT Code Recoder Excel tool. Recodes your full LH export using the design and CT code logic.
- Inputs: Design, full LH export, none value, FF variable name, CBC version column name; optionally the SKU number of an empty concept.
- Output: Recoded CSV.
Used by IT / Data Science to recode output from the CT code.
You will need the following 6 inputs (note: these differ slightly from the Excel tool):
- Your Design
- Your entire LH export . No need to delete columns, but filtering to relevant fields will improve performance.
- The value of the None
- The name of your FreeFormat variable (often FFRandom)
- The name of the column containing your CBC version (e.g. sys_CBCVersionCBC...)
- (Optional) The SKU number of the empty concept if your design contains one.
Important: In your design, the column containing your SKUs must be named exactly SKU - the code is case-sensitive.
Data Map
- When to use: When building a data map for a new survey project.
- What it does: Enriches your labels file with question text from SPSS, cleans irrelevant rows, and flags rows that need manual review.
- Inputs: Labels file (.labels), SPSS file, CBC name, last question label; optionally questions to delete.
- Output: Cleaned Excel data map ready for your review.
The tool speeds up data map creation by auto-adding question texts and removing clutter. It will clean rows such as constructed lists, sys_ rows, CBC, and negative quotas, and flags rows with ListLabels or images for manual review.
Important: This tool speeds up your work but does not replace your review. You must still check quotas, double labels, constructed lists, and other steps.
Input details:
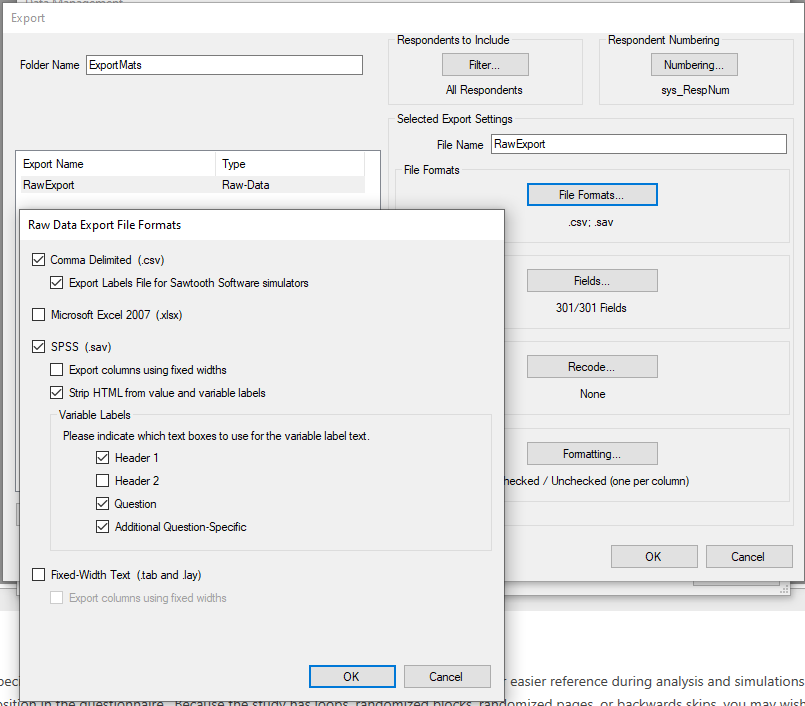
- Labels file: Your usual labels file from LH. Open it in Excel via File > Open > All Files (*.*) and click on 'Yes' and 'OK' until it opens. See the image below for more information on the export.
- SPSS file: Contains question text and answer values. See the export image below.
- CBC Name: Name of the CBC question (usually 'CBC_Random'). CBC rows will be removed from the data map as we usually don't share this with clients.
- Last Question Label: The last label of your final question (e.g. 'QualityOE' or 'FinalQuestion_7'). All rows below this are removed. If you have a MC or a Grid as final question, make sure that you include the final row of the question as well, for example 'FinalQuestion_7' when the MC has 7 answer options.
- Other questions to delete: Parts of label names to remove (e.g. 'FFRandom, CBC2_Random'). Be careful: any label containing the string will be deleted. Separate multiple values with a comma.
TIP: Export with data of only a few respondents - the tool runs faster and you only need the labels, not the full dataset.
Data export:
Deficiency Check
- When to use: Before running HB, to validate your SingleCSV for collinearity issues, or after running the design, to validate your design for collinearity issues.
- What it does: Checks your SingleCSV/Design for deficiency (collinearity between attributes).
- Inputs: Your SingleCSV or Design.
- Output: Deficiency report.
The Deficiency Check runs automatically after using any SingleCSV Recoder tool. Use this standalone tool if you already have a SingleCSV or Design and want to check it for deficiency before running STAN or before uploading your design to LH.
Drivers Analysis
Before starting, always refer to the Driver Analysis Playbook for best practices on setting up the analysis, interpreting results, and reporting insights. The playbook provides detailed guidance on methodology, key considerations, and common pitfalls.
- When to use: When you want to identify what drives a key brand evaluation score.
- What it does: Runs regression-based Key Driver Analysis; outputs importance scores, brand performance tables, and a correspondence map.
- Inputs: Stacked drivers data file, labels CSV (variable → label), dependent variable name; optionally brand, filter, and weight column names, minimum sample
- Output: XLSX file with KDA results (see first sheet of output for interpretation guide) + images.
Required inputs:
- Drivers data: Must contain RespNum, the final brand evaluation column, and one column per driver/statement. Optional columns: Brand (for per-brand KDA), Filter (1=include, 0=exclude), Weight. Data must be in stacked format - one row per respondent per brand. You can use the Driver Analysis Data Recoder to obtain the Drivers Data in the right format.
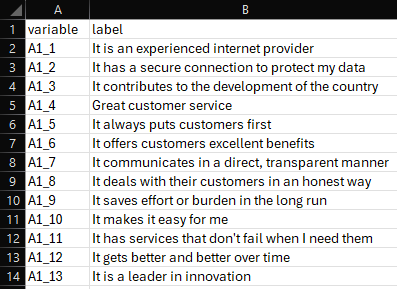
- Labels file: A CSV with 2 columns: 'variable' (column names from your data) and 'label' (the text description shown in results).
- Dependent variable name: The column containing final brand evaluation scores. In the example below, the dependent variable column is 'value'.
- Brand column: Column with brand names (e.g. McDonald's, KFC). Use 'None' for aggregate-level analysis. In the example below, the brand column is 'Brand'.
- Filter column: Column with 1/0 to select a sub-sample. Use 'None' if not applicable. In the example below, the filter column is 'Buyer'.
- Weight column: Column with respondent weights. Use 'None' if not applicable. In the example below, the weight column is 'Weight'.
- Performance Threshold: Used to recode independent variables for certain outputs. Independent variables are transformed into binary values (0/1) based on the threshold you set: Values equal to or greater than the threshold are recoded to 1, values below the threshold to 0. This transformation only affects the performance tables (Brand scores & Expectancy) and the Correspondence map. The driver analysis will continue using the original scale. This is particularly helpful for reporting Top Box or Top 2 Box results. Example: If variables use a 5-point scale and the threshold is set to 4, the performance tables will report Top 2 Box results (values of 4 and 5). The default value to use the original scale is 0.
- Minimum Sample Size: The Minimum Sample Size ensures a brand is only included in the performance tables (Brand scores & Expectancy) and the Correspondence map if it has sufficient data. Brands with fewer respondents than the minimum sample size will be excluded from these mentioned analyses but will still be included in the Key Driver Analysis (KDA). The default value is 100.
Data:

Labels:
Driver Analysis Data Recoder
Before starting, always refer to the Driver Analysis Playbook for best practices on setting up the analysis, interpreting results, and reporting insights. The playbook provides detailed guidance on methodology, key considerations, and common pitfalls.
- When to use: Before running Drivers Analysis, to reformat your raw survey data.
- What it does: Transforms a grid question + multiple select DV into the stacked format required for the Drivers Analysis tool.
- Inputs: Grid question (rows = drivers, columns = brands) + multiple select DV question. Answer option numbers must match column numbers in the grid.
- Output: Recoded data file in the correct format for Drivers Analysis.
This tool turns your raw data into data ready for KDA. Two inputs are required:
- Grid question: Rows as drivers, columns as brands.
- Multiple select DV question: Answer options should be the same as the brands in the grid question (it is fine if there are more options, e.g., an option for not considering any brand). The option numbers should match the column numbers in the grid question (e.g., column 6 in the grid is also answer option 6).
Single CSV Recoders
Please select one of the 3 SingleCSV recoders:
- Dual to Single: Use when you have a DR-None.
- Single to Single: Use when you have a DR-None and a single CSV input.
- Traditional (None): Use when you have a traditional none or no none at all (no DR-None).
Dual CSV Recoder
- When to use: Standard dual-response CBC study with a DR-None.
- What it does: Recodes dual-response CBC data into a SingleCSV. Handles multiple None options. Incomplete respondents are retained (not deleted).
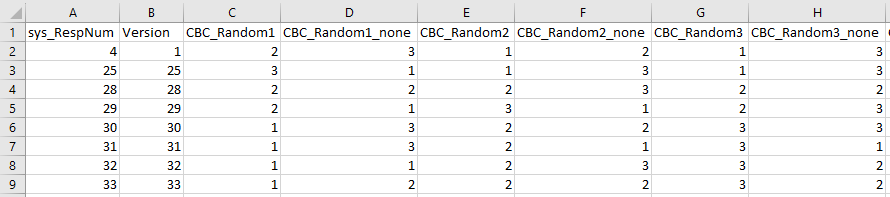
- Inputs: Design file, number of nones, response file (columns: RespNum, Version, CBC1_response, CBC1_none, CBC2_response, CBC2_none, ...).
- Output: SingleCSV with DRN.
Notes:
- DR-Yes must always have value 1; Nones have values 2, 3, etc.
- Supports up to 100 Nones - just specify the count.
- Respondents with incomplete data are no longer deleted . This allows skipped tasks.
- If you have 0 Nones, use LightHouse directly to create the SingleCSV.
- Below you can find an example of what your responses should like. You start with the respondent number and Version, followed by CBC1_response, CBC1_none, CBC2_response, CBC2_none, etc.
Responses:
eComm Recoder
- When to use: For eCommerce CBC studies using the eComm Data Processor template.
- What it does: Recodes raw LH eComm CBC data into a SingleCSV using your filled-in template.
- Inputs: Filled eComm Recoder Template including full raw LH data export and design.
- Output: SingleCSV.
Fill in the orange cells on the Setup sheet of the template as usual. Paste your design in the Design sheet and your entire raw LH export in the Data sheet - no need to pre-filter questions or split the evoked set.
Tips for better performance:
- Remove columns unrelated to the CBC (e.g. screener questions) before uploading.
- Always include: Resp ID, CBC Design, and all eComm CBC columns (CBC_RandomX, eCommDataScreenX_selectedSKUs, Concepts, noneOfTheAbove).
- Delete filter attributes from your design before running the tool.
Evoked SingleCSV
- When to use: When you want to apply ES coding to an existing SingleCSV (remove SKUs outside ES)
- What it does: Removes concepts of SKUs in an existing singleCSV that are not part of the Evoked Set.
- Inputs: SingleCSV, raw data (for sys_Respnum + ES data), ES column name, max #items in ES
- Output: SingleCSV.
Fieldwork Specs
- When to use: During or after fieldwork - mandatory to run after project completion.
- What it does: Generates a comprehensive fieldwork report: quota progress, termination analysis, data quality stats, and page times.
- Inputs: Raw LH data, cleaned IDs file, ID column name, server link, study name, admin password; optionally split variable.
- Output: Excel with quota info, terminate report, cleaned/raw data, study info, page times, and data acquisition plots.
Designed to enhance study quality by providing essential statistics throughout the project lifecycle. Post-study, it delivers insights into study performance, helping you learn and improve from each project. It is mandatory to run this after you have finished your project, so you will have an overview of all relevant data of your study. During active studies, it offers real-time data on progress, including data collection rates, screening points, and quota fulfillment based on cleaned data. Use this tool to ensure your studies run smoothly and efficiently from start to finish
Input details:
- Unmodified Raw Data: Direct export from the LH server, including incompletes and disqualified respondents (.csv).
- Cleaned IDs: XLSX file with unique ID's to clean in column A (column header must be your ID column name). Optional: add a 'FW' column with the fieldwork supplier data value.
- ID column name: Column name of unique respondent IDs (often 'sys_RespNum'). Must match across data and cleaned ID files.
- Server link: To extract the quota data from the server, Format: 'https://us.surveyme.online/G...../admin.html'. This link is given to you when you upload the study (in Lighthouse) to the server.
- Study Name: Name of your LH file (e.g. 'G1234').
- Admin Module Password: Found on the upload page in LH. Cannot contain '&' . Username is assumed to be 'admin'.
- Split variable: Optional column to split analysis by (e.g. fieldwork supplier column 'FW').
- Terminate Report last question: A field recorded for all respondents regardless of incomplete, disqualified, complete, etc. Usually 'sys_pagetime_2' or something.
- Fieldwork supplier name: Name of the FW supplier of the project. This is displayed in the general study info of the output.
- Include raw data in export: Exclude if dataset is very large and causing memory or download issues.
Note: Page Times export requires the PageTime Addon from SKIMAddons in your general footer, and the FF question 'extraData_questionTimes' must be shown to respondents.
Output details:
- Updated Quota Information: (Cleaned) quota overview in case quota information was retrieved from the server.
- Terminate Report: Indicates in which questions respondent are screened out.
- Terminate Resp Questions: Indicates per screened out respondent in which question they were screened out.
- Cleaned Data: Clean raw data.
- All Data: All raw data.
- Bad IDs: List of Bad IDs.
- Study Info: Various statistics (LOI, IR, etc.)
- Page Times: Contains page times per respondent per question.
- Data Acquisition Plots: Contains plots about data acquisition.
Filter a CSV
- When to use: When you need to keep or remove specific respondents from any CSV file.
- What it does: Filters rows from a CSV based on a respondent include/exclude file.
- Inputs: Raw data / singleCSV / utility CSV to filter (respondent ID must be in the first column) + filter file (col A: IDs, col B: 1=include / 0=exclude).
- Output: Filtered CSV.
Works on any of the following CSV types: raw data, SingleCSV, or utilities file.
- CSV to filter: The respondent ID must be in the first column.
- Filter file: Column A contains respondent numbers; column B contains 1 (include) or 0 (exclude).
Generic Recoder
- When to use: For standard CBC studies - the most commonly used recoder.
- What it does: Recodes SingleCSV attribute levels (prices, sizes, SKU numbers, promo) using a structured input template.
- Inputs: Your SingleCSV + filled Generic Input Template (.xlsx).
- Output: Recoded SingleCSV
Use this tool for recoding prices, sizes, SKU numbers, or Promo. For recoding other attributes, use the Excel tool instead.
The Generic Input Template has 9 sheets :
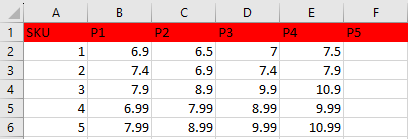
- SKU info: SKU numbers and price levels.
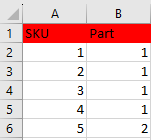
- Slopes part: Indicates Which slope each SKU belongs to. Use 0 for SKUs with a fixed price - do not leave empty.
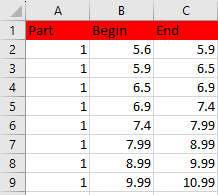
- Slopes info: 3 Columns that indicate the part, begin and end of each slope. Headers: Part, Begin, End.
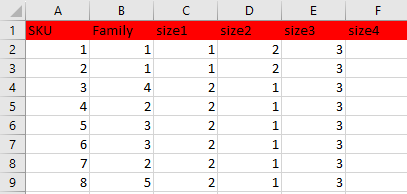
- SKU Size: Size family per SKU and recoding target. Assign family 1 to the smallest sizes.
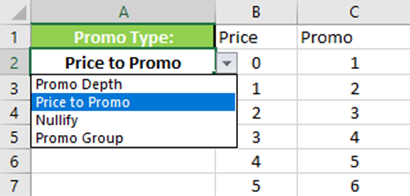
- Promo: Promo type and inputs. Options: Promo Depth, Price to Promo, Nullify, Promo Groups, Custom, CustomPro. See the Promotion Examples PowerPoint for details.
- Recode SKUs: Original → new SKU codes. Use original numbers in all other sheets. If an SKU number does not change you do not have to include the SKU number on this sheet.
- Attribute names: Maps the column names from your singleCSV to the standard names (RespNum, Task, Concept, SKU, Price, Size, Promo, Response).
- Remove columns: Columns to drop from the output.
- Order effect: Used for US studies with many SKUs. Indicate the data required to add an order effect to concept numbers.
Besides the input above, you will be asked whether you want to recode slopes, sizes Yes/No, whether you want to recode Promo no/type of promo recoding, if you want to recode SKU numbers Yes/No, and whether to include the order effect. For Slopes, Sizes, SKU numbers and the Order effect, the tool will not recode these if you select 'No'. For Promo, if you select something order than 'No', the tool will check if your type of promo is the same as what you have indicated in the Generic Input Template. If this is not the case, the code will stop. Check your inputs and try again.
SKU info:
 Slopes part:
 Slopes info:
 Size info:
SKU Promo:
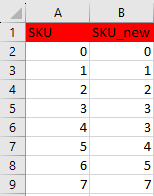
 SKU numbers:
Heatmap / Eyetracker Recoder
- When to use: After heatmap or eyetracking data collection in LightHouse.
- What it does: Recodes raw LH heatmap/eyetracker export into the format required by the Developer Toolbox analysis tool.
- Inputs: Raw LH data export, question name(s), image storage type, constructed list name(s).
- Output: Recoded files ready for the Developer Toolbox.
After selecting Heatmap or Eyetracker, provide:
- LightHouse Data: Direct export from admin module. No pre-filtering needed (removing irrelevant columns speeds up the tool though).
- Question name(s): Name(s) of the heatmap/eyetracker questions - case-sensitive . Separate multiple names with a comma.
- Type of image storage: There are two options: either the image that a respondent sees comes from one (constructed) list, or each question has it's own (constructed) list or variable that stores the image that a respondent sees. Please choose the option that your study falls under.
- Constructed list name(s): If you have one constructed list, then please provide the (case sensitive) name of the list that the tool can use to match the images to the data. If you have one (constructed) list for each uestion, please provide the name of the lists seperated by commas. Please make sure that the list names are matched correctly with the question names. Separate multiple names with a comma.
After recoding, find the link to the Heatmap analysis tool in the Developer Toolbox here .
Image Cropper
- When to use: When preparing a batch of product images for CBC setup.
- What it does: Auto-crops whitespace from around the edges of each image individually.
- Inputs: Image files (.png, .jpg, or .jpeg).
- Output: Cropped images (.png). Always check the results manually.
Upload the images you want to crop. The tool detects and removes white space around the edges of each image individually.
Important: R is not an image editing tool. Final images are approximate - always check all output images and adjust manually where needed. The tool's value is in processing large batches quickly.
MaxDiff Flatline Check
- When to use: After MaxDiff data collection, as a QualityCheck step before running HB.
- What it does: Detects flatliners (zero variance in chosen concepts) and generates the SingleCSV for you.
- Inputs: Design, raw data, MaxDiff exercise name; for Express MaxDiff also the items-per-respondent file.
- Output: Flatline report + SingleCSV.
Required inputs:
- Your design
- The raw data
- The name of your MaxDiff exercise
- Whether you have an Express MaxDiff (respondents see a subset of items)
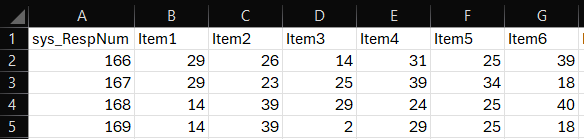
- If Express: upload the items seen per respondent file (see format below)
Respondents with variance = 0 are flagged as flatliners (always chose the same concept). Respondents with very low variance are not automatically cleaned - discuss with your SPM what the flatline threshold is for cleaning.
Express Layout:
MBC Counts & Combies
- When to use: For MBC (Menu-Based Conjoint) projects, after data collection.
- What it does: Calculates per-SKU/price counts, choice combinations, cluster analysis, and model validation; also prepares files for the next recoding steps.
- Inputs: Cleaned MBC dataset (.xlsx), design file, product names file, study type (instore/delivery), study ID.
- Output: Counts & Combies Excel file + basket analysis choices file.
Note: the script expects standard column names from LH - do not rename them after export.
Inputs:
- Instore or Delivery: Select the MBC dataset type.
- Dataset: Cleaned MBC data (.xlsx).
- Design: The design file imported into LH.
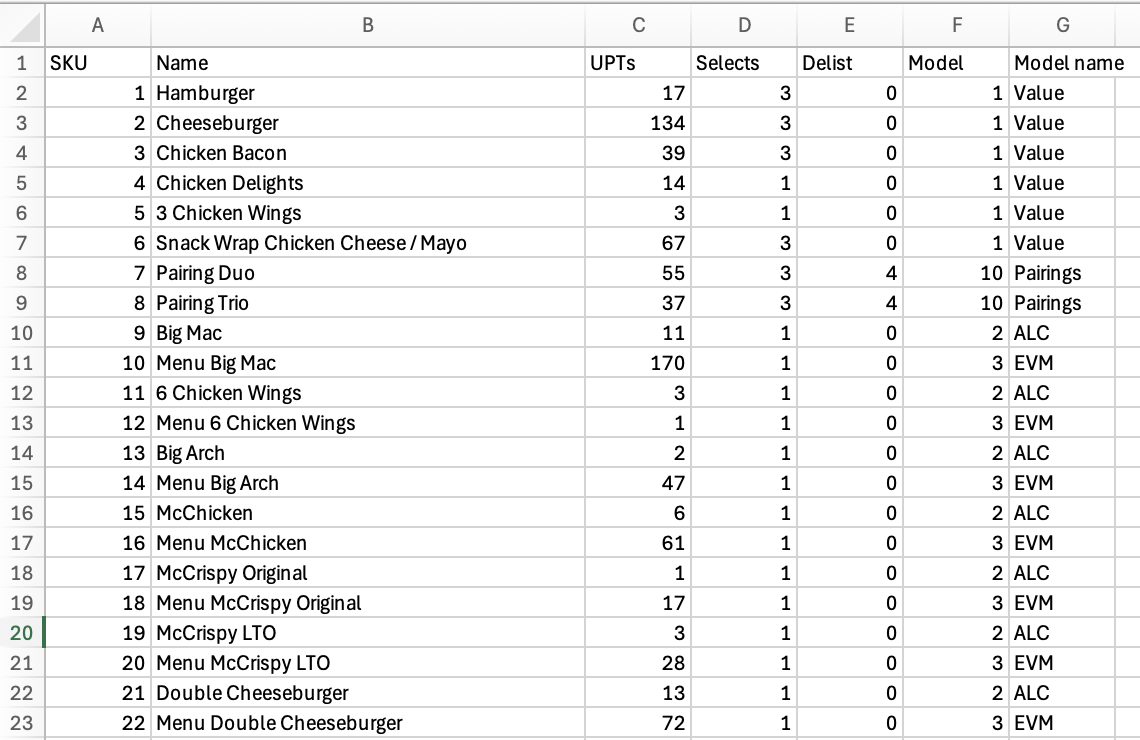
- Product names file: Contains product name, UPT values, selection frequency, and delisting price point. It also allows you to select your models and their names so you can check whether the MBC estimation went correctly. If you are not yet sure what your final model configuration will be, fill in what you expect. Once you have your final model configuration, update this and run the tool again. Don’t change the column names of this file, as they are used in the script. You can see an example below.
- Study ID: Identifier used in the output filename.
Output sheets in count_overview_output.xlsx:
- Counts: Per-SKU counts for each price point + multi-select DV counts.
- MBC Data: MBC data in the format required for the Recoding Tool.
- Aggregated MBC Data: All choices per respondent across tasks, with cluster assignment.
- Combinations: All combinations ranked most to least popular.
- Combinations per Resp: Combinations per respondent.
- Cluster Summary: Cluster info for analysing choice behaviour. Smaller clusters tend to include respondents who are very similar. You can find more information about their choices in the Aggregated MBC Data sheet by filtering on the value in the column ‘cluster’.
- Elbow Analysis: Additional clustering details.
- High Similarity Pairs: Contains information about the similarity in choices across respondents. It uses aggregated data across all tasks. Respondents who have identical choices across all tasks might be dubious, so you can easily filter them.
- Model Counts: Counts per model to validate against model shares. These values should be very similar; large differences might indicate incorrect interactions or model dynamics.
The product names file:
McD Large Attribute Recoder
- When to use: For McDonald's MBC studies where EVM and Large EVM need to be merged into one attribute.
- What it does: Merges EVM and Large EVM SKUs into a single attribute in the MB data.
- Inputs: Raw cleaned data (.xlsx), pairs file (EVM SKU nr + Large EVM SKU nr), study ID.
- Output: Recoded MBC raw data file, ready for use in the 'Step 1 recoding' Excel tool.
Required inputs:
- Raw cleaned data ( .xlsx )
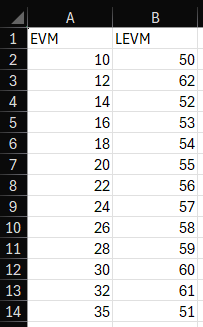
- Pairs information: combine EVM and Large EVM SKU numbers. Column 1 = EVM SKU, Column 2 = Large EVM SKU. See example below.
- Study ID
Pairs information:
McD Masterfile Processor
- When to use: At the start of a McDonald's MBC project, to extract setup info from the Masterfile.
- What it does: Processes the MF and prohibitions sheets into ready-to-use inputs for the usual MBC tools.
- Inputs: Filled McD Masterfile Template (both 'MF' and 'prohibitions' sheets must be completed).
- Output: Excel with 7 sheets covering LH lists, SKU input, prohibitions, recoding matching, mini MF, weighting Wendy inputs, and price ladder rules.
Output sheets:
- Lighthouse Lists: Lists for programming (MBCLength, MBCSku, skuNameList, skuPicList, skuPrices) + html code for MBCLayout that initializes the SKUs based on whether they are single or multi-select
- SKUinput: The information to put in the SKUinput sheet of the first design tool (SKU design input).
- price_prohi_specs: Prohibitions for the 'price_prohi_specs' sheet of the first design tool (SKU design input).
- Recoding Matching Sheet: DV, delisting, and multiselect info for the Step 1 recoding tool.
- Mini MF: Mini Masterfile to set up the simulator.
- Weighting Wendy Inputs: The ‘Want’ column (i.e. 1-UPT, UPT) for the Weighting Wendy calibration tool.
- Price Ladder Rules: Price ladder rules for the export to Global.
Important notes:
- Do NOT change names in row 2 of the MF sheet - the code references these.
- Make sure no random cells are filled below the SKU list.
- Fill in both 2-way AND 3-way prohibitions in the 'prohibitions' sheet using the dropdown menus and indicate what type of prohibition constraint applies (abs>, abs>= or rel<=).
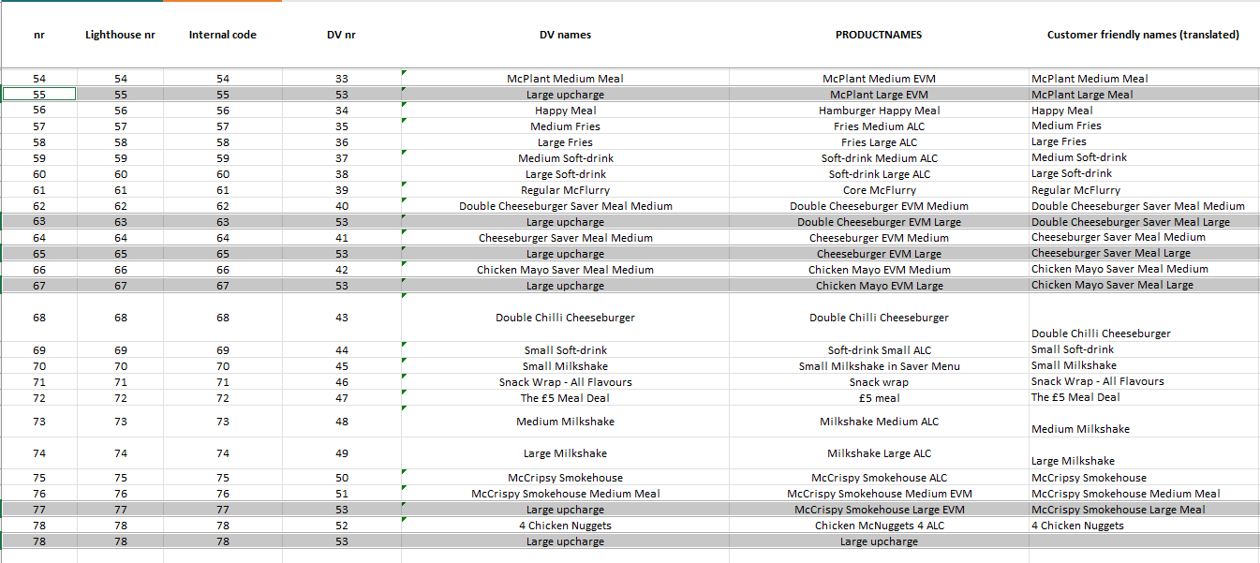
Large Upcharge: If all large EVMs are recoded as 1 item, ensure:
- A row in your SKU list that contains the Large upcharge with all the info filled in (prices, UPTs etc.) and the Product Name for the upcharge should contain the words “large upcharge”, “large upgrade” or “large EVMs” and should be identical to the DV name.
- Include the Large EVMs (e.g. Big Mac Large EVM) in the SKU list and make sure that they all have the same DV nr and DV name as the Large Upcharge Product but have different Lighthouse nr (as they are different in the programming).
- You also need to fill in customer-friendly names, base price index and the prices (= prices of the large upcharge SKU) for each of these Large EVMs.
Correct way to fill in the large upgrade and Large EVM information in the “MF” sheet:
MDS Mapping
- When to use: When you want a visualize the difference between SKUs by using MultiDimensional Scaling plots. How do the SKUs interact with each other?
- What it does: Runs MDS on SingleCSV counts and produces positioning plots. Outputs in SKIM or L'Oréal PowerPoint style.
- Inputs: SingleCSV, SKU labels file; optionally SKU images and evoked set settings.
- Output: PowerPoint with MDS plots + coordinates CSV. Preview plot shown in the dashboard.
The MDS plots are built using your singleCSV (counts) rather than utilities. This is different than the previous model from a couple years ago.
Required inputs:
- SingleCSV: Standard layout: RespNum, Task, Concept, SKU , ..., Response. SKU column must be named exactly 'SKU'. None-concepts must have SKU = 0. E.g. if you're using an empty concept with SKUnr XX, make sure to recode this back to 0.
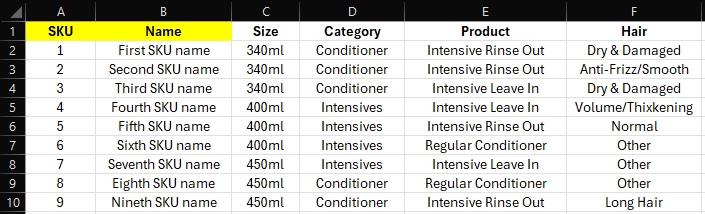
- SKU Labels: Start with columns 'SKU' and 'Name' (keep names short as they will be plotted!), then add label columns as needed. No spaces in column names (use 'PackSize' not 'Pack Size'). No numeric-only labels (use '400ml' not '400'). No special characters (e.g. é). Max 15 groups per label recommended. Please look at the example below.
-
Evoked Set:
- 'No' - All respondents saw all SKUs
- 'Yes, across all SKUs' - Standard use of Evoked Set: ES logic was applied for all respondents and all SKUs)
- 'Yes, as a sample split' - Some SKUs are only shown to a specific subset of the respondents, e.g. half of the respondents sees NPD 1 and the other half sees NPD 2. The rest of the SKUs are always shown to everybody.
In case of a sample split, we will correct the counts used for the MDS plots, for their lower showing rate. In all cases of an Evoked Set, it is extremely important that there is overlap between the SKUs/respondents. If half of your sample sees SKU 1-10, and the other half sees 11-20, there are no overlapping SKUs and you won't be able to run MDS for all the SKUs together. - SKU images: Optional. Add an 'image_name' column to your labels file (exactly that name) with filenames including extension. Keep images under 500kb.
- Template: SKIM or L'Oréal style.
- SKU numbers on plot: Optional; useful for quick checks but less visually clean.
- Labels as datapoints: Optional. Select a label column whose values will be used as the plotted points instead of circles. Please keep these labels short!
- Filter on label: Optional. Plot only datapoints belonging to a specific label value. E.G.: 'Conditioner' in the example below. You will then only plot the datapoints that have the label 'Conditioner'.
You can zoom into the preview plot by selecting an area and double-clicking. Double-click again to zoom out.
SKU Labels:
Merge Datafiles
- When to use: When combining 2 raw data files (e.g. different waves or fieldwork suppliers).
- What it does: Row-binds 2 data files; merges matching columns and adds unique columns from each file.
- Inputs: 2 CSV files. Respondent ID must be in the first column (sys_RespNum) and must be unique across both files.
- Output: Merged CSV.
The tool automatically aligns columns, preserves the structure of the first file, and inserts unique columns from the second file near their original positions. Columns ending in '_other' are standardised for clean merging.
Important: Respondent numbers must be unique across both files. If two respondents share the same number, their data may be merged incorrectly. Always verify after download.
Merge SingleCSVs
- When to use: When you recoded parts of a large dataset separately and need to combine them.
- What it does: Row-binds multiple SingleCSV files into one.
- Inputs: 2+ SingleCSV files. Column names must be identical across all files.
- Output: Combined SingleCSV. Note: large files may increase download time.
Upload all the SingleCSVs you want to combine. The tool requires identical column names across all files - otherwise it will not work.
PBC Recoder
- When to use: For Preference-Based Conjoint (PBC) studies with custom per-respondent designs.
- What it does: Recodes raw LH PBC data into SingleCSV format. Supports No None, Traditional None, and DR-None.
- Inputs: Raw LH export, CBC exercise name, screenerArray variable name, None type; optionally number of DR Nones and DR responses file.
- Output: SingleCSV.
Required inputs:
- Raw LH export (must include sys_RespNum and CBC/FreeFormat columns)
- Name of the CBC exercise (usually 'CBC_Random')
- Name of the screenerArray variable (usually 'screenerArray')
- None type: No None, Traditional None, or DR-None
- If DR-None: number of nones and DR responses file (format below)
DR-None Responses:
Price Perception
- When to use: For price perception studies (primarily McDonald's, but applicable to others).
- What it does: Analyses respondents' perceived prices per product category; outputs statistics and visualisations.
- Inputs: Cleaned data (.xlsx), price information file, PP question identifier, confidence question identifier, study ID.
- Output: Statistics Excel file + optional boxplots and histograms.
Required inputs:
- Raw cleaned data (.xlsx)
- Price information file (see example below)
- PP Question identifier - McDonald's uses 'A4_'
- Confidence Question identifier - McDonald's uses 'A4a'
- Whether you want boxplots as output
- Study ID
Output: boxplots (optional), histograms (price estimation distributions per category), and a statistics Excel file.
More detailed documentation to follow.
Price information:

SingleCSV Flatline Check
- When to use: As a QC step after recoding, before running HB.
- What it does: Identifies flatliners based on None-choosing frequency (SKU Price) or concept variance (MultiAtt).
- Inputs: SingleCSV, flatline type, and (for None-based) the maximum number of Nones allowed.
- Output: Cleaned SingleCSV + respondent-level cleaning overview.
Two flatline types are available:
- None (SKU Price): Counts how many times a respondent chose the None (SKU = 0). Set the maximum allowed; respondents above the threshold are cleaned.
- Concept (MultiAtt): Looks at variance in chosen concepts. Respondents with variance = 0 (same concept every task) are cleaned. Used primarily for MultiAtt studies.
SingleCSV Recoder
- When to use: Standard single-response CBC study with a DR-None.
- What it does: Recodes single-response CBC data into a SingleCSV with DRN. Handles multiple Nones. Incomplete respondents are retained.
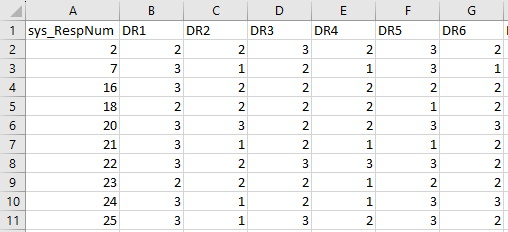
- Inputs: SingleCSV, number of nones, DR-None responses file (col 1: RespNum, then one DR column per CBC question).
- Output: SingleCSV with DRN.
Notes:
- DR-Yes must always have value 1; Nones have values 2, 3, etc.
- Supports up to 100 Nones - just specify the count.
- Respondents with incomplete data are no longer deleted . This allows skipped tasks.
- If you have 0 Nones, use LightHouse directly to create the SingleCSV.
- Below you can find an example of what your DRN responses should look like. You start with the respondent number, followed by a DR response per task.
DR-None Responses:
Sorting Design
- When to use: During CBC study setup, to sort or randomise SKU/task order in the design.
- What it does: Sorts or shuffles your design by brand blocks, SKU number, concept, task order, or full randomisation. Group order varies per design version.
- Inputs: Design file; optionally a brands/groups file (for brand block sorting).
- Output: Sorted/randomised design.
Sorting options:
- Brand blocks: Groups SKUs of the same brand/category/etc. together on the shelf.
- SKU: Sorts SKUs numerically from 1 to n.
- MultiAtt Randomization: Randomises concepts in a Multi-Attribute design.
- Randomize tasks only: Shuffles task order; concepts remain untouched.
- Full Randomization: Randomises SKU order within each task. Useful for e.g. eCommerce studies to eliminate position bias.
If you use Brand Blocks:
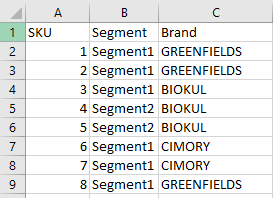
- Provide a brands file (first column: 'SKU'; subsequent columns: group labels such as brand, category, size, etc.). Priority of columns goes from left to right.
- Use 'Low'/'High' as column headers to sort numerically if you want to sort SKUs based on increasing/decreasing numeric order. For this, use numeric values (0.5 rather than 0.5L). You can use Low/High columns multiple times.
- If you want a random order (which will be constant within a design), you should give each SKU a different filter value (such as their SKU number), this way each SKU is in its own group.
- You also have the option to indicate SKU order that is applied after the Brand Blocks order, using the SKU order dropdown. This can be random (but constant within a version) or in the order of the Masterfile (low to high SKU numbers).
Additional options:
- Specify tasks to exclude from reshuffling (leave empty to shuffle all). If you want to keep only 1 task in place, insert the task number, and if you want to keep multiple tasks in place, give these task numbers separated by a comma, such as: '1,2,11,12'.
- For SKU-Price studies: recode SKU = 0 to the empty SKU number (#SKUs + 1), and its other attributes to level 1.
- Snake order recoding: available for shelf display studies ( do not use for Virtual Shelf - use the VS snake option instead).
- Remove the Size attribute if it was added automatically by the design tool but it is not needed.
Brand Block Example:
Split SingleCSV
- When to use: When a SingleCSV is too large to open and edit.
- What it does: Splits a SingleCSV into N equal parts, keeping all rows for each respondent in the same file.
- Inputs: SingleCSV + number of output files.
- Output: N separate CSV files (downloaded as a ZIP). Large files may increase download time.
Traditional SingleCSV Recoder
- When to use: CBC with a traditional none, or no none at all (no DR-None).
- What it does: Recodes traditional-none CBC data into a SingleCSV.
- Inputs: Design file + response file (format: sys_RespNum, Version, CBC_Random1, CBC_Random2, ...).
- Output: SingleCSV.
Your response file should have the format: sys_RespNum - Version - CBC_Random1 - CBC_Random2 - etc.
A traditional none is fine; no none is also fine.
Utilities Check
- When to use: After running HB, to QualityCheck your utilities file.
- What it does: Calculates importance scores, general statistics per level, and checks constraint compliance.
- Inputs: STAN template + utilities file; optionally a filter file and filter selection.
- Output: Excel with importance scores, stats, and constraints check.
Required inputs:
- The STAN template - the same file you uploaded to STAN
- The utilities file from STAN
- Indicate whether you want to use a filter ; if yes, provide the filter file and select the filter to apply
Output sheets:
- Importance Scores: Ignore these if your design includes slopes - they won't be meaningful in that case.
- Stats: General statistics, such as average, max, and min utility per attribute level.
- Constraints Check: Shows for each constraint how many respondents satisfy it.
Common mistakes: All attribute names must be unique and maximum one word. Filter value should be 0 when not applying a filter.
Click here to see examples of input and output. Make sure your inputs match the example format (column order etc.).Utility Recoder -99
- When to use: After HB, when certain attribute levels were never shown or never chosen by some respondents and therefore must be recoded to -99.
- What it does: Recodes utility values to -99 for unshown or unchosen attribute levels.
- Inputs: SingleCSV, Coding & Constraints file, utilities file, recoding type; optionally a per-attribute coding type file.
- Output: Recoded utilities file.
Required inputs:
- Your SingleCSV used to run STAN
- Your Coding and Constraints file used to run STAN
- Your utilities file to apply the recoding to (output of STAN)
- The recoding type : recode levels not shown, not chosen (both applied to all attributes and levels), or a custom mix per attribute
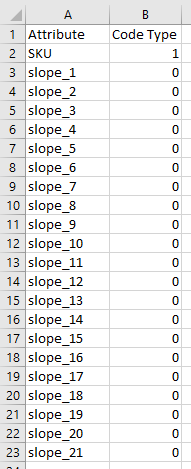
- (Optional) A custom recoding type file : One row per attribute, indicating the coding type per attribute (0 = No coding, 1 = Not Shown, 2 = Not Chosen). See the image below for reference. The list of attributes should be the same as in the Coding and Constraints file.
Note: recoding applies to all levels and attributes, not just SKU attributes. When using the optional coding type file, you can apply different coding per attribute.
Optional Coding Type Example:
Virtual Shelf Recoder
- When to use: For Virtual Shelf CBC studies using the VS Recoder Template.
- What it does: Recodes raw LH Virtual Shelf data into a SingleCSV. Supports multibuy buttons.
- Inputs: Filled VS Recoder Template.
- Output: SingleCSV + (if multibuy) a labels file explaining each promotion level.
Fill in the orange cells on the Setup sheet of the template as usual. Paste your design in the Design sheet and your entire raw LH export in the Data sheet - no pre-filtering or evoked set splitting needed.
Tips for better performance:
- Remove columns unrelated to the CBC before uploading.
- Always include: Resp ID, CBC Design, CBC_RandomX, VirtualShelfScreenX_selectedSKUs, Concepts, noneOfTheAbove.
Multibuy buttons - if used, read carefully:
- Indicate multibuy usage on the Setup sheet, and when you use v4 of the VS Data Processor template, also indicate the delimiter used for the multibuy buttons ( , or | ). If you're still using v3, it is assumed that the delimiter is a comma.
- Paste multibuy inputs in the 'Multibuy (optional)' sheet: col A = all SKUs, subsequent cols = 'Multi-buy text Promotion type x' columns from the VS setup tool.
- Promo level 1 always means 'No Promo' and is not included in the Multibuy sheet.
- Your Promo attribute must be named exactly 'Promo' in the design - any other name will stop the tool.
After recoding, you can download the SingleCSV and a labels file explaining each (new) promotion level. This is completely based on your inputs, so make sure these are correct!
General info
On this sheet you'll find an overview of the tools (who is responsible for which tool, in what project phase do you use the tool, and when do you use the tool). You can also find the list of updates to the Mastertool, in which you can easily find what has been changed recently.
For updates/requests, please contact m.bierhuizen@skimgroup.com
To be added/updated:
- TBD...
| Tool Overview | |||
|---|---|---|---|
| Tool | Phase | Toolmatser | When to use |
| Compare Inputs | File Handling | Mats | You have two files that should be identical and want to verify this. |
| Correspondence Analysis | Analysis | Remco / Mats | You want to map brand/category positioning relative to a set of criteria. |
| Counts | Analysis | Mats | You want to get frequency counts from your SingleCSV. |
| CT Code Recoder | Analysis | Mats | You want to recode CT Code / Evoked Set data to a singleCSV (used by IT / Data Science). |
| Data Map | Analysis | Mats | You want to build a data map for a new survey project. |
| Deficiency Check | Analysis | Kees / Mats | You want to check for collinearity in your design/singleCSV. |
| Drivers Analysis | Analysis | Oriol / Mats | You want to identify what drives a key brand evaluation score. |
| Driver Analysis Data Recoder | Recoding | Mohamed | You want to reformat your raw survey data for Drivers Analysis. |
| Dual CSV Recoder | Recoding / Analysis | Mats | You want to recode raw CBC + DR none data to a singleCSV. |
| eComm Recoder | Recoding / Analysis | Mats | You want to recode raw eComm data into a singleCSV |
| Evoked SingleCSV | Recoding / Analysis | Mats | You want to apply ES-coding to an existing singleCSV (remove concepts outside ES) |
| Fieldwork Specs | Analysis / project wrap-up | Daan | You want a comprehensive fieldwork report. |
| Filter a CSV | File Handling | Mats | You want to filter a CSV on a subset of respondents. |
| Generic Recoder | Recoding / Analysis | Mats / Ian | You want to recode your singleCSV with slopes, sizes, promo's and SKUnrs. |
| Heatmap / Eyetracker Recoder | Recoding / Analysis | Mohamed | You want to recode raw LH data to required format for DevToolbox. |
| Image Cropper | Set-up | Mats | You want to crop whitespace from images. |
| MaxDiff Flatline Check | Analysis | Mats | You want to check for Flatliners in MaxDiff data. |
| MBC Counts & Combies | MBC | Daan | You want to obtain counts- and cluster analysis after data collection. |
| McD Large Attribute Recoder | MBC | Daan | You want to merge EVM and Large EVM SKUs into one attribute. |
| McD Masterfile Processor | MBC | Daan | You want to process the masterfile into ready-to-use inputs. |
| MDS Mapping | Analysis | Remco / Mats | You want to visualize SKU interactions/differences in a plot. |
| Merge Datafiles | File Handling | Tristan | You want to combine 2 datafiles (e.g. different waves) |
| Merge SingleCSVs | File Handling | Mats | You want to combine multiple singleCSV's into 1 big one. |
| PBC Recoder | Analysis | Mats | You want to recode Preference-Based Conjoint data to a singleCSV. |
| Price Perception | Analysis | Daan | You want to run Price Perception analysis (primarily McDonald's). |
| SingleCSV Flatline Check | Analysis | Mats | You want to check for flatliners in your singleCSV. |
| Single CSV Recoder | Recoding / Analysis | Mats | You want to recode singleCSV + DR none data to a singleCSV. |
| Sorting Design | Set-up | Marjolein | You want to sort or randomise SKU/task order in the design. |
| Split SingleCSV | File Handling | Mats | You want to split your large singleCSV in smaller ones. |
| Traditional (None) SingleCSV Recoder | Recoding / Analysis | Mats | You want to recode traditional (None) CBC data to a singleCSV. |
| Utilities Check | Analysis | Marjolein | You want to run quaility check on your utilities |
| Utility Recoder -99 | Recoding / Analysis | Remco | You want to recode utilities to -99 for levels not chosen/shown. |
| Virtual Shelf Recoder | Recoding / Analysis | Mats | You want to recode raw VS data to a singleCSV. |
Updates
Update Log
| Date | Person | Tool | Update |
|---|---|---|---|
| 10-07-2025 | Mats | Evoked SingleCSV | Added first version of Evoked SingleCSV tool. |
| 19-06-2025 | Mats | Virtual Shelf Recoder | Updated the template to v4, for the multibuy input template update. |
| 18-06-2026 | Mats | MDS | Added some checks to make sure your Labels file includes at least the columns SKU, Name and 1 or more Label columns. |
| 18-06-2026 | Mats | Counts | Added colourcoding to SKU-Price matrix, and you could now also replace SKU/Price by different attribute names to run cross counts on other attributes. |
| 07-04-2026 | Mats | Dual CSV Recoder | Adjusted the code to also work when you have a different number of concepts per task. |
| 18-03-2026 | Mats | General | Updated Help Tab and Info Tab. |
| 13-03-2026 | Mo | Driver Analysis Data Recoder | Added the first version of the Driver Analysis Data Recoder tool. |
| 13-03-2026 | Mats | Counts | In case of a multibuy VS setup, the SKU and Price counts will be corrected for the 'double' counts. |
| 13-03-2026 | Mats | MDS | Code should now automatically change non-standard letters to standard ones. |
| 13-03-2026 | Mats | Virtual Shelf Recoder | Check for 'undefined' data, and fix multibuy coding in case of evoked set errors. |
| 05-02-2026 | Mats | Counts | You can now run counts per segment (for example quota levels). |
| 04-02-2026 | Mats | General | HUGE back-end update. |
| 04-02-2026 | Mats | Compare Inputs | Added the first version of the 'Compare Inputs' tool. |
| 04-02-2026 | Mats | Filter a CSV | Added the first version of the 'Filter a CSV' tool. |
| 26-01-2026 | Mats | Counts | Fixed colorcoding in output in case of ASD. |
| 23-01-2026 | Mats | Heatmap/Eyetracker | Minor bug fix eyetracker. |
| 12-12-2025 | Mats | General | Minor textual updates. |
| 28-11-2025 | Mats | Generic Recoder | Slopes sometimes wrongly showed very small numbers (10^-15), these are now nullified (this had no affect on HB though, no worries). |
| 28-11-2025 | Mats | Utility Recoder -99 | Took into account new HB output with new columns. |
| 28-11-2025 | Mats | Utility Check | Took into account new HB output with new columns. |
| 28-11-2025 | Daan | Price Perception | Added first version of Price Perception tool. |
| 11-11-2025 | Mats | MDS | Added the option to indicate whether you have an EvokedSet or not. |
| 11-11-2025 | Mats | Sorting Design | Added the option to remove the Size attribute from your SKU Price design. |
| 10-11-2025 | Daan | McD Large Attribute Recoder | Added first version of the McD Large Attribute Recoder. |
| 10-11-2025 | Daan | MBC Counts & Combies | Total revamp of the tool! |
| 14-10-2025 | Mats | MaxDiff Flatline | Added option to select MaxDiff name. |
| 14-10-2025 | Mats | Counts | Added option to calculate SKU x Price counts. |
| 14-10-2025 | Mats | MBC Counts & Combies | Bug fixed. |
| 28-08-2025 | Mats | Sorting Design | Added automatic Deficiency check here as well. |
| 28-08-2025 | Mats | Sorting Design | Bug fixed related 0-recoding. |
| 26-08-2025 | Mats | Virtual Shelf Recoder | Bug fixed related to evoked set. |
| 19-08-2025 | Mats | Sorting Design | Added the option to recode SKU=0 to SKU=nr_SKUs + 1, and the other attributes to 1. |
| 19-08-2025 | Mats | Fieldwork Specs | Added extra error check for when you only upload complete data. |
| 19-08-2025 | Mats | Virtual Shelf Recoder | Added extra error check for when an SKU is missing. |
| 07-08-2025 | Mats | MDS | Updated the input requirements of the Labels file to align with the inputs of MAT's Decision Trees. |
| 07-08-2025 | Tristan | Merge Datafiles | Added first version of Merge Datafiles. |
| 14-07-2025 | Daan | McD Masterfile Processor | Added first version of the McD Masterfile Processor. |
| 24-06-2025 | Mats | Fieldwork Specs | Updated split report in study info sheet, and added sheet that shows you the terminate question per respondent. |
| 17-06-2025 | Mats | MDS | Added check to see if there are SKUs missing in your singleCSV. |
| 06-06-2025 | Mats | Utility Recoder -99 | Updated Resp name to 'id'. |
| 27-05-2025 | Marjolein | Sorting Design | Added the option 'Full Randomization'. |
| 20-05-2025 | Mats | Generic Recoder | Minor bugs fixed. |
| 17-04-2025 | Daan | MBC Counts & Combies | Added first version of the MBC Counts & Combies. |
| 27-03-2025 | Mats | PBC | Bug fixed. |
| 26-03-2025 | Mats | MDS | Updated L'Oreal template and plots. |
| 20-03-2025 | Mats | Fieldwork Specs | Added the a Page Time Extractor to the FWS tool. |
| 19-03-2025 | Mats | SingleCSV Flatline Check | Added the first version of the SingleCSV Flatline Check tool. |
| 05-03-2025 | Mats | General | Bugs fixed. |
| 26-02-2025 | Mats | MaxDiff Flatline Check | Bug fixed if you have empty rows in your Responses. |
| 26-02-2025 | Mats | Error Log | Bug fixed in Error Log. |
| 26-02-2025 | Mats | Virtual Shelf Recoder | Bug fixed for multi select without ES. |
| 19-02-2025 | Mats | Drivers Analysis | First version of Drivers Analysis added. |
| 11-02-2025 | Mats | MDS | Bug fix. |
| 11-02-2025 | Mats | MaxDiff Flatline Check | The MaxDiff Flatline Check will now also give you the singleCSV, and it can handle Express MaxDiffs now. |
| 23-01-2025 | Mats | Generic Recoder | Added Order Effect for US studies. |
| 23-01-2025 | Mats | Sorting Design | For sorting tasks you now have more flexibility. Also, when sorting on Brand blocks, you can easily indicate if you want SKUs within a brand/group to be randomized or sorted on increasing order. |
| 23-01-2025 | Mats | General | Changed the tool's response when crashing. Error log available for debugging. |
| 23-01-2025 | Mats | Deficiency | Fixed a bug for when you are testing a design instead of SingleCSV. |
| 14-01-2025 | Mats | Generic Recoder | Promo bug fixed. |
| 08-01-2025 | Mats | Utility Check | Minor bug fixed relating to punctuation in attribute names. |
| 08-01-2025 | Mats | CT Code Recoder | Improved running time. |
| 13-11-2024 | Mats | Virtual Shelf Recoder | Bug fixed for when SKU column is called mainSKU. |
| 23-10-2024 | Mats | General | Added the option to rename your files before downloading. |
| 22-10-2024 | Daan | Fieldwork Specs | Fixed bugs. |
| 18-10-2024 | Mats | PBC | Fixed PBC bugs. |
| 17-10-2024 | Mats | MDS | Applied a different way of calculating coordinates. Coordinates will be slightly different than previously, but they should be better. |
| 30-09-2024 | Mats | Generic Recoder | Added the option to not recode slopes, but only Size/Promo/SKU nr. |
| 30-09-2024 | Mats | Sorting Design | You can now sort based on increasing / decreasing values. |
| 30-09-2024 | Mats | Utility Check | Bug fixed relating to punctuation in attribute names. |
| 30-09-2024 | Mats | Fieldwork Specs | Added first version of the Fieldwork Specs tool. |
| 26-08-2024 | Mats | Virtual Shelf Recoder | Added first version of the Multibuy button recoding. |
| 26-08-2024 | Mats | eComm Recoder | Added first version of the eComm Recoder. |
| 26-08-2024 | Mats | Generic Recoder | Fixed Promo Depth recoding and added a PowerPoint with examples to the templates folder. |
| 15-07-2024 | Mats | General | Improved user-friendliness. |
| 02-07-2024 | Mats | Merge SingleCSVs | Renamed Rowbind SingleCSV tool to Merge SingleCSVs. |
| 24-06-2024 | Mo | Heatmap/Eyetracker | Added functionality to process multiple questions using one quota. |
| 24-06-2024 | Mats | CT Code Recoder | Re-added the CT Code Recoder, formerly known as the Evoked Set Recoder. |
| 13-06-2024 | Mats | MDS | You can now plot SKU images. |
| 11-06-2024 | Mats | Sorting Design | It is now also possible to randomize Concepts in a Multi-Att design. |
| 10-06-2024 | Mats | Generic Recoder | Bugs fixed, and added a new promo recoding called 'Custom Pro' (only for pro's). |
| 21-05-2024 | Mo | Heatmap/Eyetracker | Added Heatmap / Eyetracker Recoder. |
| 17-05-2024 | Mats | Virtual Shelf | The VS LH template now has a feature to randomly delist/disable x SKUs on screen. The Matsertool has been updated with a new input template for this feature. |
| 29-04-2024 | Mats | Sorting Design | Fixed the random shuffling of tasks across designs. |
| 24-04-2024 | Mats | Correspondence Analysis | Added the first version of the Correspondence Analysis tool. |
| 23-04-2024 | Mats | MDS | You can filter the datapoints that you are plotting based on a label and keep the same scaling as if you're plotting all datapoints. |
| 22-04-2024 | Mats | PBC | Added the first version of the PBC recoder (Preference Based Conjoint). |
| 15-04-2024 | Mats | MDS | You can now add two labels to a plot, where one label will become the datapoints. |
| 05-04-2024 | Mats | Deficiency | Deficiency checker is now also available as separate tool. |
| 03-04-2024 | Mats | General | Some input checks have been added to DualToSingle, GR, MDS, SingleToSingle, Util Recoder -99. |
| 29-03-2024 | Marjolein | Sorting Design | Added possibility to only sort the task order. |
| 28-02-2024 | Mats | SingleCSV Recoders | When using the GR, VS or any singleCSV recoder, a deficiency check is run automatically to test collinearity. |
| 27-02-2024 | Marjolein | Sorting Design | Fixed sorting when you only have 1 column. |
| 22-02-2024 | Mats | Counts | Fixed color coding when you have a none-SKU. |
| 20-02-2024 | Mats | MDS | Updated instructions. |
| 20-02-2024 | Mats | General | Google Analytics. |
| 14-02-2024 | Marjolein | Utility Check | Fixed some issues with symbols in attribute names. |
| 14-02-2024 | Marjolein | Sorting Design | Added option of SKU sorting to sorting tool. |
| 07-02-2024 | Mats | Virtual Shelf | Fixed bugs in Virtual Shelf recoder. |
| 25-01-2024 | Mats | Virtual Shelf | Removed Evoked Set Recoder for Data Science. Replaced by Virtual Shelf Recoder. |
| 25-01-2024 | Mats | Sorting Design | You can now add as many filters as you like. |
| 23-01-2024 | Mats | General | Fixed bug in VS, updated help tab for Counts and Sorting Tool. |
| 13-01-2024 | Mats | Single CSV Recoder | Added the Traditional (None) SingleCSV recoder, and combined it with the Dual to Single and Single to Single. |
| 12-01-2024 | Mats | General | Added FAQ's tab. |
| 11-01-2024 | Mats | General | Added Image Cropper and Split SingleCSV back into the Matsertool. Problems solved!! |
| 11-01-2024 | Mats | Utility Check | Fixed error caused by similar column names. |
| 05-12-2023 | Mats | General | Temporarily removed Image Cropper and Split SingleCSV code, as they crashed the server. |
| 05-12-2023 | Mats | Split SingleCSV | Added function to split singleCSV's into multiple files. |
| 05-12-2023 | Mats | Merge SingleCSVs | Added function to combine singleCSV's. |
| 23-11-2023 | Qiurui | General | Secured website + added login code. |
| 23-11-2023 | Mats | Dual CSV Recoder | Adjusted code to handle skipped task/DR. |
| 23-11-2023 | Mats | Single CSV Recoder | Adjusted code to handle skipped task/DR. |
| 16-11-2023 | Mats | Virtual Shelf | Added error message when you don't have an SKU column in your design. |
| 16-11-2023 | Mats | MDS | Added the option to add SKU numbers to the MDS plots and updated the dashboard plot. |
| 30-10-2023 | Marjolein | Utility Check | Removed the SOP part (output from HB) and changed the input structure for the utilities part. |
| 17-10-2023 | Mats | General | General updates. |
| 10-10-2023 | Mats | DR & VS | Replaced loops by foreach function to reduce running time. |
| 03-10-2023 | Mats | Data Map | Added first version of the Data Map tool. |
| 25-09-2023 | Mats | General | Increased overall speed. |
| 21-09-2023 | Mats | Sorting Design | Increased speed to <1 second. |
| 06-09-2023 | Mats | Utility Recoder -99 | Added first version of the Utility Recoder -99 tool. |
| 04-09-2023 | Mats | Sorting Design | Fixed Sorting tool. |
| 26-07-2023 | Mats | Image Cropper | Output images will always have the .png extension. Also the input only allows .png, .jpg and .jpeg. |
| 26-06-2023 | Mats | MDS | Integrated the PowerPoint Templates in R, hence you don't have to upload the template anymore. |
| 19-06-2023 | Mats | Generic Recoder | Added a more flexible way of Promo recoding, called Custom. |
| 07-06-2023 | Mats | Image Cropper | Added the first version of the Image Cropper tool to the Matsertool. |
| 05-05-2023 | Mats | Generic Recoder | Data extraction of the input template is now based on sheet name instead of sheet order. Sheet names have been blocked in the input template v3. |
| 24-04-2023 | Mats | Utility Check | Partially changed input to input template. |
| 21-04-2023 | Marjolein | General | Improved explanations of tools. |
| 21-04-2023 | Mats | Generic Recoder | Added the option to delete columns based on column names. |
| 21-04-2023 | Mats | MDS | Fixed output. |
| 20-04-2023 | Mats | General | Improved explanations of tools. |
| 31-03-2023 | Mats | Generic Recoder | Added promo recoders for Promo Depth, Price to Promo, Nullifying and Promo Groups. |
| 28-03-2023 | Marjolein | Utility Check | Fixed a deprecated function. |
| 24-03-2023 | Mats | CT Code Recoder | Added the option to exclude an empty concept. |
| 17-03-2023 | Marjolein | Sorting Design | Added the possibility to sort based on two criteria. |
| 09-03-2023 | Mats | General | Hid Possi Generator tool, not functioning 100% yet. |
| 06-03-2023 | Mats | MDS | Fixed the labels of the output. |
| 06-03-2023 | Mats | MaxDiff Flatline | Added MaxDiff Flatline Check tool. |
| 02-03-2023 | Mats | General | General updates layout. |
| 23-02-2023 | Mats | Counts | It is now possible to indicate whether you have a DR-None in your singleCSV. |
| 23-02-2023 | Mats | Virtual Shelf | Fixed concept number of the none when using SKU based, no evoked, single choice. |
| 23-02-2023 | Mats | Single CSV Recoder | Split code of Dual to Single and Single to Single. |
| 20-02-2023 | Marjolein | Sorting Design | Added the option to shuffle tasks around. |
| 17-02-2023 | Mats | MDS | Added option to upload L'Oreal PowerPoint template. |
| 16-02-2023 | Mats | CT Code Recoder | Added Evoked Set Recoder. |
| 07-02-2023 | Marjolein | Utility Check | Added the possibility to get filtered outputs. |
| 18-01-2023 | Marjolein | Utility Check | Added some general utilities checks to the output. |
| 17-01-2023 | Mats | Virtual Shelf | Updated Virtual Shelf recoder to only have 1 input file. |
| 16-01-2023 | Marjolein | Sorting Design | Added the Sorting SKUs tool. |
| 16-01-2023 | Mats | General | Uploaded first version of Possi Generator. |
| 22-12-2022 | Mats | Generic Recoder | Updated GR, now it's also possible to rename/recode SKU numbers. |
| 22-12-2022 | Mats | Single CSV Recoder | Updated SingleCSV recoders: inputs will be ordered on Resp number to make sure responses are linked to the right respondent. |
| 21-12-2022 | Mats | MDS | Updated MDS Mapping for L'Oreal, + added colour template, SKIM or L'Oreal. |
| 18-11-2022 | Mats | Generic Recoder | Bugs fixed + added a new sheet to Generic Recoder input that renames SingleCSV columns. |
| 17-11-2022 | Mats | Utility Check | Added Marjolein's SoP On the Fly tool. |
| 15-11-2022 | Mats | Generic Recoder | Updated Generic Recoder with Ian's code. Increased speed. |
| 11-11-2022 | Mats | Generic Recoder | Removed interpolation function from Generic Recoder, increased speed. |
| 10-11-2022 | Mats | Generic Recoder | Updated Generic recoder to only have 1 input file. Tried to implement progressbar but execution time tripled. |
| 09-11-2022 | Mats | MDS | Updated MDS Mapping tool to also export Powerpoints. |
| 19-07-2022 | Mats | General | Creation of the Matsertool. |
Frequently Asked Questions
On this sheet you'll find some Frequently asked questions, categorized per tool. Please also check the help tab to find tool-specific help. This page will be filled once we have Frequently Asked Questions
Use of the app
--TBD--
Compare Inputs
--TBD--
Correspondence Analysis
--TBD--
Counts
--TBD--
CT Code Recoder
--TBD--
Data Map
--TBD--
Deficiency Check
--TBD--
Drivers Analysis
--TBD--
Driver Analysis Data Recoder
--TBD--
Dual to Single CSV
--TBD--
eComm Recoder
--TBD--
Evoked SingleCSV
--TBD--
Fieldwork Specs
--TBD--
Filter a CSV
--TBD--
Generic Recoder
Q: The GR crashes while recoding size. How is this possible?
A: Please make sure that the size families are connecting. I.E. families 1-2-3-4, and not 1-3-4-5 (2 is missing).
Heatmap / Eyetracker Recoder
--TBD--
Image Cropper
--TBD--
MaxDiff Flatline Checker
--TBD--
MBC Counts & Combies
--TBD--
McD Large Attribute Recoder
--TBD--
McD Masterfile Processor
--TBD--
MDS Mapping
Q: The PowerPoint cannot be downloaded, but I can download the csv file. How do I fix this?
A: If the coordinates are available but you cannot download the PowerPoint, it means that something is wrong with your labels. Possible errors are: Your labels have weird signs (such as è, é), or you have too many unique labels per group. Read the help tab to find a solution.
Merge Datafiles
--TBD--
Merge SingleCSVs
--TBD--
PBC Recoder
--TBD--
Price Perception
--TBD--
SingleCSV Flatline Check
--TBD--
Single to Single CSV
--TBD--
Sorting Design
--TBD--
Split SingleCSV's
--TBD--
Traditional (None) SingleCSV
--TBD--
Utilities Check
--TBD--
Utility Recoder -99
--TBD--
Virtual Shelf Recoder
--TBD--